Surging wages and prices have people asking whether the U.S. economy is having an episode of 1970s inflation déjà vu. The short answer is no, not at this moment. Why? Because it’s not just what you pay in wages, but also what you get for them that matters.
Runaway inflation in the 1970s was fueled by wage-price spirals. These cycles happen when higher prices from inflation lead workers to demand higher wages to keep up, which causes further increases in prices and inflation, and so on. Back then, the Fed broke the cycle with a policy remedy that came with the painful side-effect of high unemployment and a nasty recession—a fate we’d like to avoid today.
Despite recent worries, there’s no compelling case that we’re in a 1970s redux. The explanation lies in the unit cost of labor, also called unit labor cost. This measure expands on wages by factoring in what was paid for what was made.
Why does this matter? Conventional thinking says higher wages lead to more money chasing products, which sounds like a recipe for inflation. But this ignores the fact that the number of products might change too, which is likely since workers are paid to produce.
Consider a donut shop worker who gets paid $10 to make 20 donuts. If their wages go up to $12, their unit cost of labor would increase. More income might allow them to bid up the price of goods, contributing to inflation.
But if the worker ends up making 24 donuts, then the change in goods matches the change in wages: both went up 20% so unit labor costs stay the same. If we apply this to all workers across the economy, we see that the “bidding-up” effect of higher wages is absorbed by productivity.
We can better understand the wage-price connection by looking at past trends in the unit cost of labor. First, the inflation episode of 1973-75:
The summer of 1972 started out with inflation at a manageable level as the green line indicates. At the same time, the blue line shows growth in wages tracking well over twice that of prices. It would take another year for inflation to take off, ultimately boosted by rapid increases in unit labor costs as shown by the red line. The result: wage-push inflation and a wage-price spiral.
The situation from 1977-81 looks similar:
Consider again that inflation started at manageable levels (by 1970s standards) even while wages were growing rapidly. Again, inflation and unit labor costs take off together, setting off a wage-price spiral that was ultimately halted by the crushing policies of the Fed.
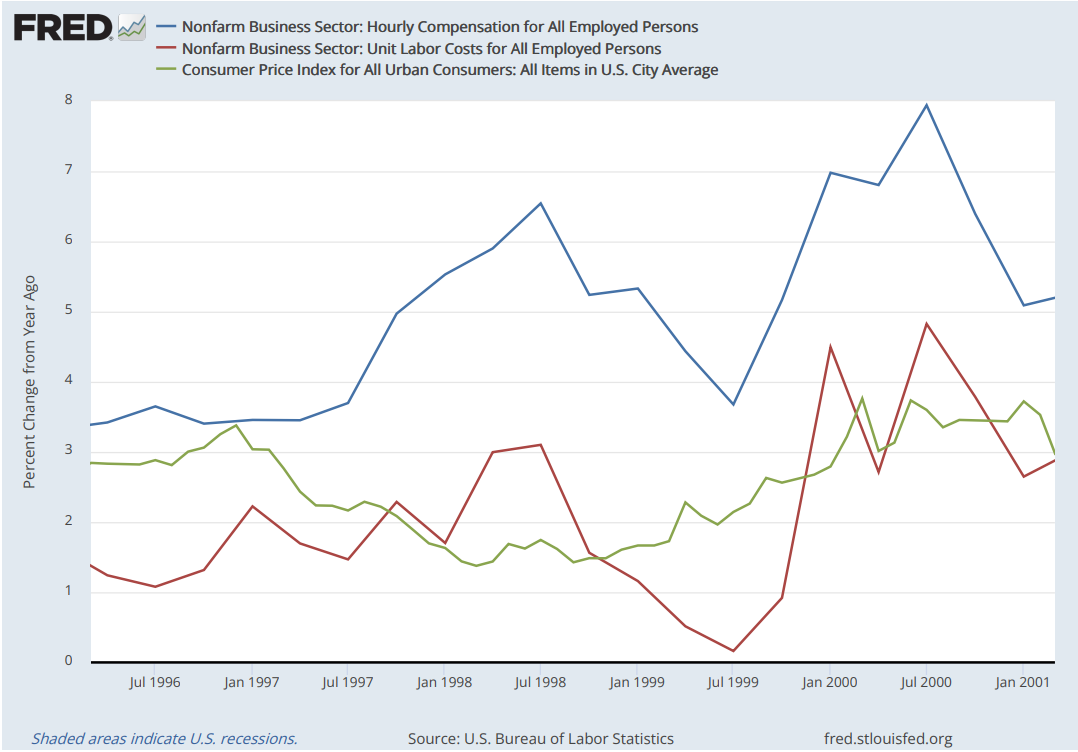
There are times when fast growing wages have had little to no effect on inflation. Take the case of 1996-2001:
Wage growth surged in the summer of 1997, but inflation moved the opposite direction. Notice that unit labor cost growth was relatively mild at this time, which reflects increases productivity that absorbed the potential inflationary effects.
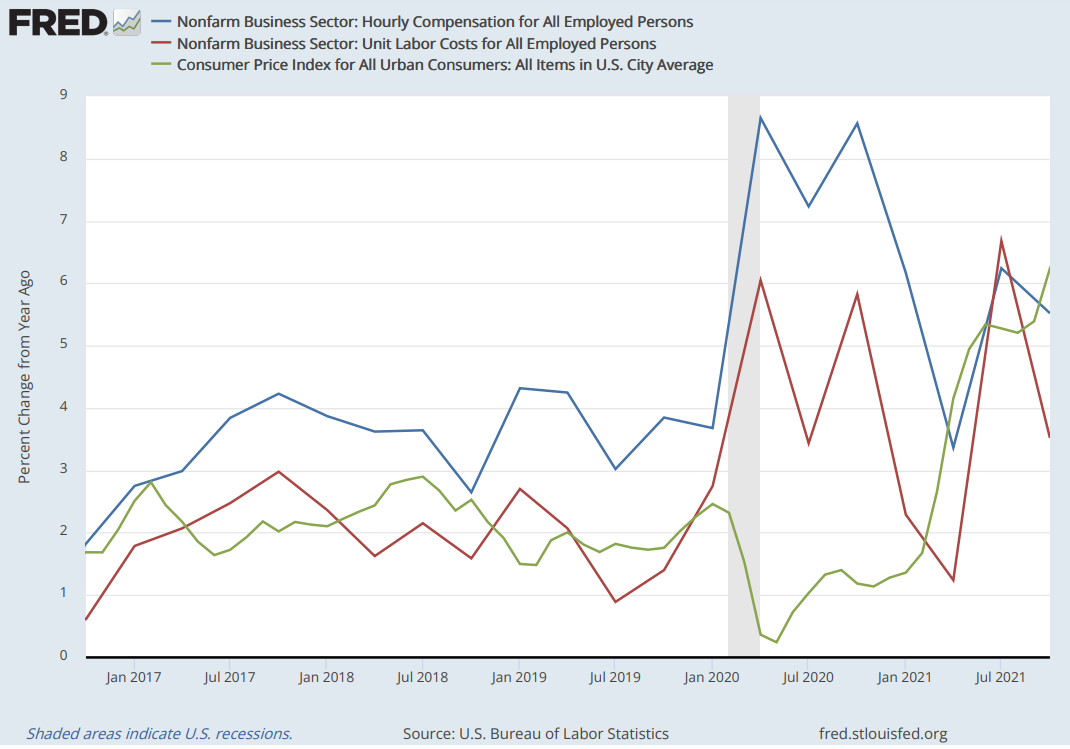
So where do we stand today? Consider the data from the last 5 years:
The story is sleepy up until the pandemic, when both wages and unit labor costs abruptly increased. But drops in demand from shutdowns canceled any inflationary effect this might have had. As the pandemic wore on, wages continued to grow. Unit labor costs grew as well, but by far less than compensation.
Even with the recent uptick, growth in unit labor costs over the past two years still amounts to less than half what was seen in the episodes from the 70s. We’re a far cry from the wage-push inflation of the past.
Might the conditions arise for a wage-price spiral? The risk exists, but the current wage-price data do not make a compelling case that we are in one.
For now, the primary culprit for our current inflation troubles is the one that’s grabbed the most headlines in the recent past—global supply chain pressures. See the chart from the Fed below:
Stay tuned, more to come.


